Pages

Wednesday, 15 April 2020

How Google Cloud is helping global governments during the COVID-19 pandemic, and our future plans to work with the public sector

How Google Cloud is helping global governments during the COVID-19 pandemic, and our future plans to work with the public sector

google cloud network-01.jpg
We are deeply committed to providing the public sector with the best technology to help improve government services and increase operational effectiveness, and we continue to work with government agencies to advocate for and contribute to the responsible and beneficial use of technology. Around the world, government agencies are working hard to meet citizen needs and weather the impact of COVID-19, and we are proud that many of our solutions are being used as part of this critical work. 
New solutions to support government agencies during COVID-19 As the COVID-19 situation continues to evolve, we’re committed to supporting our public sector customers around the world by helping them provide the services that citizens rely upon. 
Internationally, we’re working with a number of governments to provide collaboration solutions and tools to track the spread of COVID-19. For example, in Spain, we’ve set up an app for the regional government in Madrid to help citizens perform self-assessments of coronavirus symptoms and offer guidance, easing the demands on the healthcare system. In Italy, the 70,000+ employees working in the Veneto region’s healthcare system are relying on G Suite to maintain their high level of service and patient care during the COVID-19 crisis. And in Australia, the Australian Government Department of Health launched its Coronavirus Australia App. Built on Google Cloud, the app offers real-time information and advice about the fast changing COVID-19 pandemic. 
In Peru, the Judiciary branch is using Google Meet to continue operating during the nation-wide quarantine. Through video conferences they are carrying out both internal meetings and also hearings. By doing this, attorneys, lawyers and judiciary clerks don’t have to physically attend court, keeping the virus from spreading, while maintaining the administration of justice in the country.
And in Norway, the City of Trondheim has been using G Suite to establish strong and effective collaboration for its employees which now is more important than ever. The accumulated number of Google Meet sessions over an only 7 days period passed the 60,000 threshold while the video conferencing experience was smooth, intuitive and frictionless for all participants. Using Google Cloud instead of relying on legacy on-premises solutions for making this possible, helps the City of Trondheim to stay connected and keep each other up to date even in these difficult times. With G Suite’s Google Meet, the city can continue with political meetings relevant to the community and schools are using it to keep the classes running. 
Speaking of schools, we’re supporting remote learning for public schools and universities around the world. From Italy to South Korea and the United States to South Africa, our Google Meet technology is enabling teachers to hold classes to keep kids learning. In Malaysia, where schools are closed in response to COVID-19, we’ve been hosting daily webinars for teachers, bringing them up to speed on how they can leverage Google tools to teach from home. In Italy, we worked with the Italian Ministry of Education—the governing body accountable for millions of Italian schoolchildren—to rapidly shift students entirely to remote learning. Our teams banded together, and engineers worked around the clock to speed up the enrollment process, even making a virtual help desk available for timely activation and support. As a result, the Ministry of Education was able to help bring millions of students online in a matter of days.
Our future plans to support public sector customersWe’ve significantly ramped our resources to support government agencies recently, and we are exploring new ways to support public sector customers. We believe that technology is a critical component of government services and that we can provide solutions to government agencies to help them best accomplish their mission. As our government solutions become more robust, and as we continue to gain important certifications to service important government workloads, we are leaning into expanding our engagement with the public sector. 
We continue to be transparent about the work we will do in this space, and we plan to participate in a number of large upcoming RFIs and RFPs, including with the U.S. State Department and National Oceanographic and Atmospheric Administration, as well as qualifying to perform unclassified work under the recently announced Commercial Cloud Enterprise (C2E) initiative, and engaging with other government agencies around the world on a range of important projects.
We are fully committed to serving the public sector, especially at this extraordinary time, and we look forward to working with government agencies as they seek to optimize their use of cloud services to streamline and improve government operations. Read more about our work with the public sector here.

How Google Cloud is helping COVID-19 academic research

How Google Cloud is helping COVID-19 academic research

Google Cloud B3.jpg

As COVID-19 continues to grow in impact, healthcare and life science researchers are in a race to understand more about the novel coronavirus, and are increasingly turning to cloud technologies to aid them in their work.
We’re so grateful for the work of these experts, and want to support them with tools and technologies that can help them combat this pandemic. Today, we’re sharing more on a number of initiatives that we’re engaged with to support researchers and the organizations and communities they serve.
Helping researchers forecast COVID-19 spread and impactThe Laboratory for the Modelling of Biological + Sociotechnical Systems (MoBS) in the Network Science Institute at Northeastern University started running large-scale, data-driven model simulations on Google Cloud in January to estimate how mitigation strategies such as travel restrictions and social distancing policies would impact the spread of infection. The models are tremendously complex, containing dozens of parameters and huge amounts of data, and require enormous amounts of compute power, data processing, and storage. 
By using Google Cloud’s High Performance Computing (HPC) capabilities, including batch processing via the Cloud Life Sciences API, Northeastern University researchers have been able to simultaneously run thousands of preemptible Virtual Machines (PVMs) to power their work. This has reduced the time it takes to run complex simulations from days to hours. Furthermore, when the simulations are complete, they can then analyze the results using BigQuery and quickly share these insights with researchers and public health agencies around the world to accelerate the shared understanding of how the virus is spreading. 
The benefit is tremendous. To date, Northeastern University researchers have been able to generate over nine million different models and analyze more than 5,500 terabytes of resulting data. They also assessed the relative risk of importing cases (visualized using Google’s free visualization tool Data Studio), and published their findings in Science.
“Developing data-driven models for predicting COVID-19 infection spread and potential impact is monumental as we race to slow the virus,” said Dr. Matteo Chinazzi, Associate Research Scientist at MoBS. 
Continuing to support critical research We are mobilizing $20 million in Google Cloud credits to enable researchers to harness the power of the cloud in their fight against COVID-19. To administer these credits effectively, we are partnering with the Harvard Global Health Institute to identify promising research opportunities and apply Google Cloud’s capabilities to support them. Harvard Global Health Institute has gathered a team of scientific advisors from a diverse range of disciplines to review submissions. Researchers who need Google Cloud capacity for work on COVID-19 can submit proposals directly to us—applications will be considered on a rolling basis.
“With academic researchers racing to discover potential treatments and therapies, collaboration is more important than ever. Our partnership with Google provides these researchers much needed resources to speed up the global response to COVID-19,” said Dr. Ashish K. Jha of the Harvard Global Health Institute. “We’re considering all different types of research approaches like clinical research, bench science research, drug delivery and therapeutics research, health services and policy research, and epidemiological research to address the urgency of the pandemic.”
We are also supporting researchers at the University of Virginia Biocomplexity Institute who are running daily epidemic simulations on Google Cloud. The results of these simulations are datasets that help state, local, and national governments track the spread of COVID-19, assess the impact of interventions, decide on how and when interventions will be relaxed and make decisions on how and where to allocate resources. 
Bringing data analytics and machine learning to more researchersTo make data more widely available and accessible for researchers, Google Cloud launched the COVID-19 Public Dataset Program which enables free querying of COVID-19 related datasets in BigQuery. This includes the widely referenced Johns Hopkins University cases data (which can also be visualized in Google Sheets as a dashboard), as well as datasets that may prove relevant in COVID-19 research such as the American Community Survey and Open Street Maps. Additionally, we have introduced seven new Social Determinant of Health (SDoH) datasets available in the program that can help researchers identify which communities in the United States are most vulnerable to the pandemic.
In March, the White House and supporting institutions called upon the AI community to develop new text and data mining techniques to examine the COVID-19 Open Research Dataset (CORD-19), the most extensive machine-readable coronavirus literature collection to date. To help, we asked our Kaggle community of data scientists to join the effort, and to also take part in additional challenges to forecast the spread of COVID-19. The contributions from those efforts, including an ML-curated literature review, can be found here.
Accelerating drug discovery research efforts at lower costsResearchers are working around the clock to better understand COVID-19 and minimize its impact on both our health and the global economy. By distributing their work across tens of thousands of virtual machines on Google Cloud, researchers are able to speed up their models and analyses, resulting in substantial savings in both time and resources. Google Cloud preemptible VMs are a great way to run these types of easily distributed, fault-tolerant research applications, enabling researchers to accelerate the computational portion of their research at a fraction of the cost of standard VMs. 
With the goal of accelerating as many COVID-19 related research projects as possible, Google is expanding access to preemptible VMs through PVM specific credits to support COVID-19 initiatives, in addition to the general cloud credits mentioned earlier in this post. As we receive COVID-19 research proposals, Google will work with researchers to identify ways they can accelerate and scale up their work through the use of preemptible VMs, as is the case in the following example.
Developing a new drug in the United States typically costs between 2-3 billion dollars and takes about ten years. Teams at Harvard Medical School and Dana Farber Cancer Institute (DFCI) are using VirtualFlow, an open-source scalable virtual drug discovery platform running on Google Cloud that utilizes preemptible VMs, to more quickly and accurately narrow down promising drug targets to accelerate the discovery of therapies and treatments for COVID-19 patients. 
VirtualFlow is helping them target billions of drug compounds against SARS-CoV-2 proteins in a matter of days, greatly increasing their capacity to study and analyze potential therapies for COVID-19.
“The virtual testing approaches we are using have massively reduced the time required for drug and treatment discovery and will hopefully lead to faster development of therapeutics for diseases,” said Christoph Gorgulla, a postdoctoral research fellow at Harvard Medical School. 
“Leveraging the abundance of structural data available on the SARS-CoV-2 proteins we are using Google Cloud’s technology to identify inhibitors of viral proteins. The use of hundreds of thousands of computational cores at Google Cloud, allows us to finish this task of screening a billion compounds, (~12 billion docking instances) in a couple of weeks. To accomplish this on a standard laptop would take 1500 years”, said Haribabu Arthanari, who is an assistant professor at the Harvard Medical School.
SARS-CoV-2.jpg
SARS-CoV-2 main protease with a virtual hit compound docked into the protein active site.
Once a short-list of promising pharmaceutical compounds have been identified, the team from Harvard Medical School will work with researchers at other institutions with facilities in place to begin testing. At the same time, the VirtualFlow team will run additional screens against databases of already-approved drugs to see if any contain these compounds. Harvard Medical School also has a number of other research collaborations running in parallel with other institutions to match the most promising drug compounds, which will allow their work to progress more rapidly. 
Continuing to make data privacy and security a priority Data is the cornerstone of educational and academic research, and the privacy and security of that data is critically important. Our Trust Principles ensure data on Google Cloud is handled in accordance with widely recognized patient privacy and data security practices, and businesses and organizations that use Google Cloud remain in complete control of their data.
Google Cloud’s commitment to supporting educational and academic research is core to our DNA, and we’ll continue to find ways to help researchers and organizations apply cloud technologies for the benefit of all.

From raw data to machine learning model, no coding required


From raw data to machine learning model, no coding required


Machine learning was once the domain of specialized researchers, with complex models and proprietary code required to build a solution. But, Cloud AutoML has made machine learning more accessible than ever before. By automating the model building process, users can create highly performant models with minimal machine learning expertise (and time).
However, many AutoML tutorials and how-to guides assume that a well-curated dataset is already in place. In reality, though, the steps required to pre-process the data and perform feature engineering can be just as complicated as building the model. The goal of this post is to show you how to connect all the dots, starting with real-world raw data and ending with a trained model.

Use case

Our goal will be to predict the monthly average incident response time for the Fire Department of New York (FDNY). We’ll start by downloading historical data from 2009-2018 from the NYC OpenData website as a CSV.
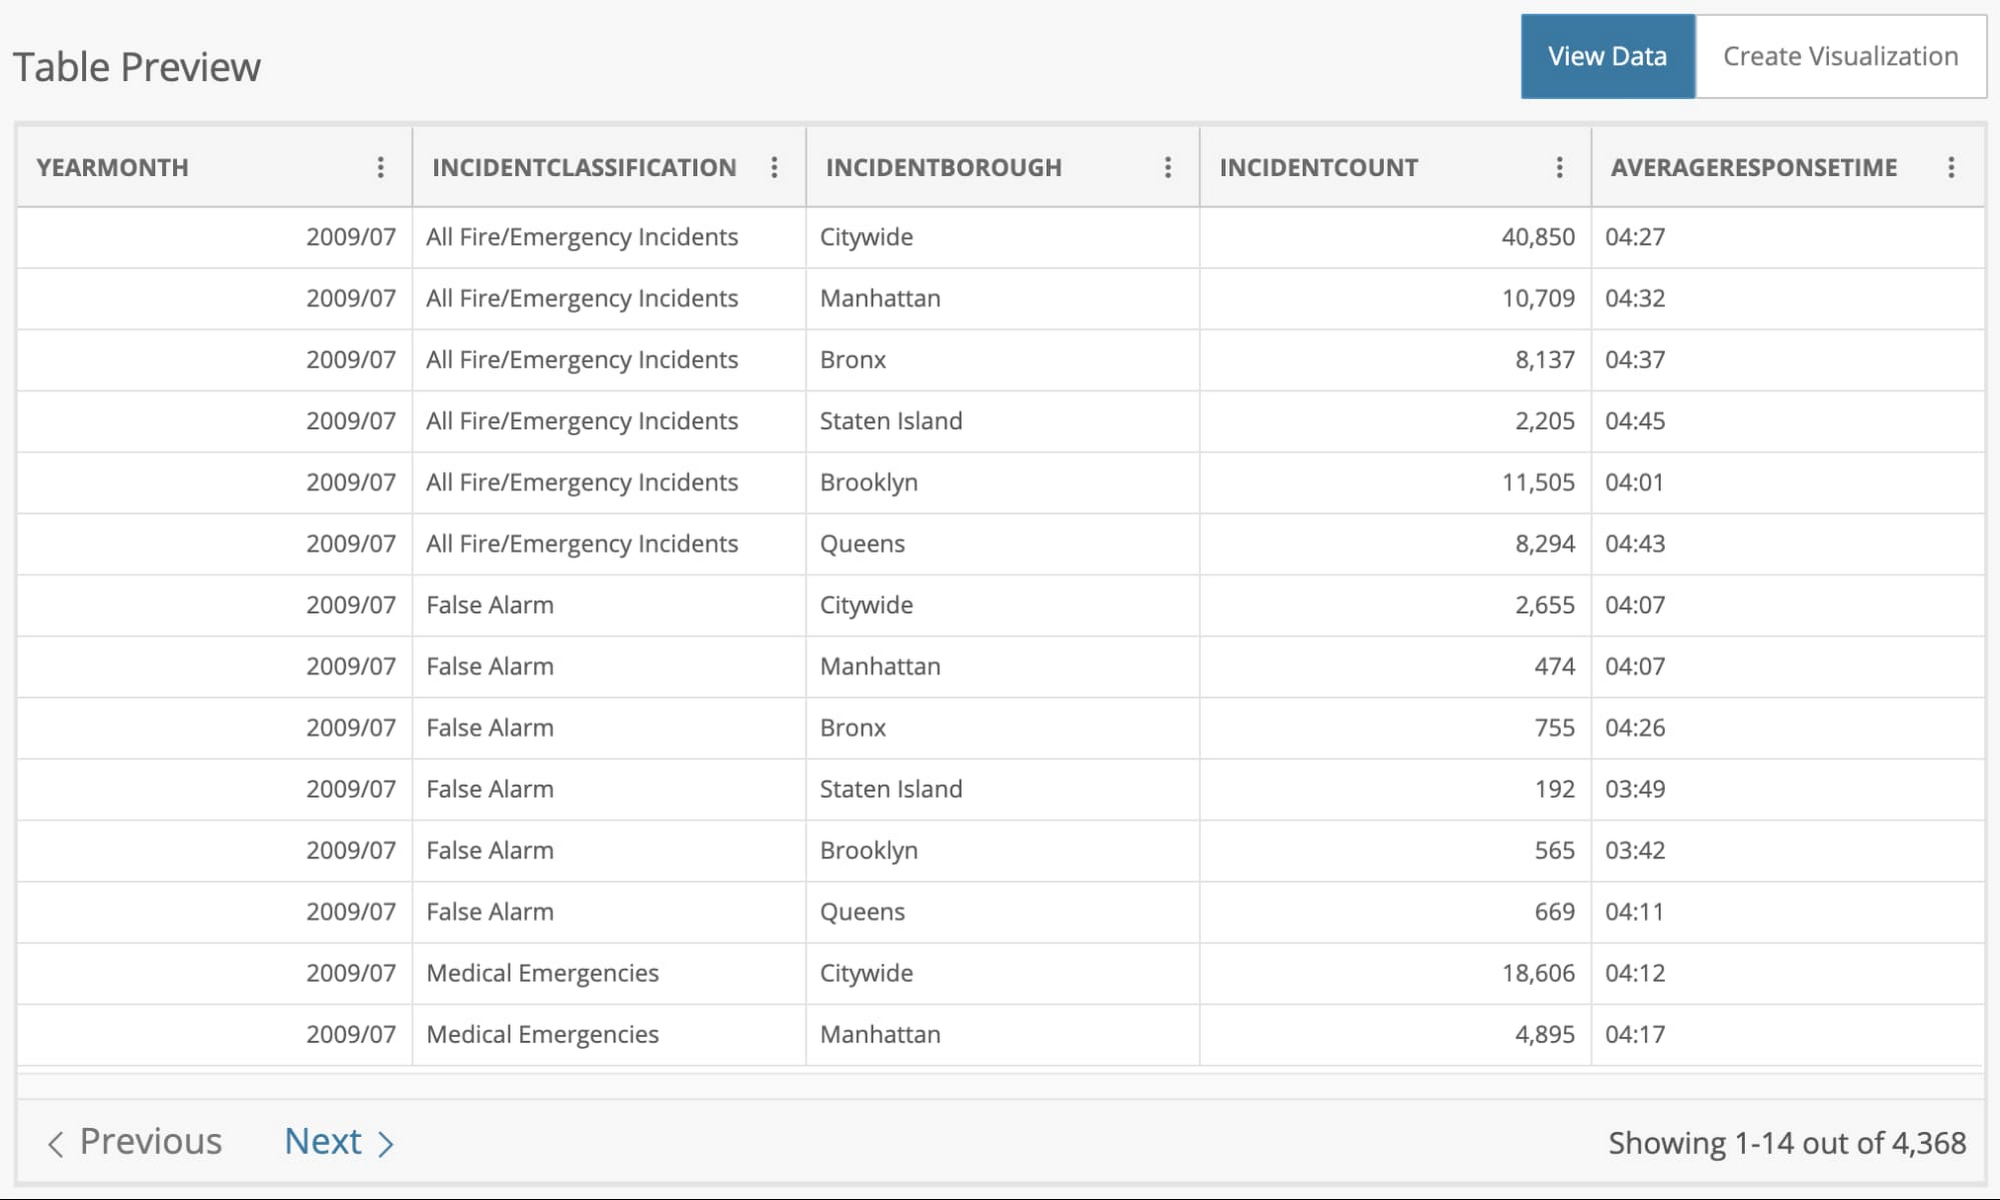
The dataset has 4,368 rows, each with the average response time for that month. The data is partitioned by the incident type (False Alarm, Medical Emergency, etc.), borough, and the number of incidents during that month.


1.jpg

Notice that the column we'd like to predict, AVERAGERESPONSETIME, is in a mm:ss format. We'll need to change that into a numeric format, such as seconds. This is an example of a processing step on the raw data that is required to build a model.

Getting started

We'll be working with four products in this post:
  • Cloud Storage: the storage service our raw data is stored in
  • Cloud Data Fusion: the data integration service that will orchestrate our data pipeline
  • BigQuery: the data warehouse that will store the processed data
  • AutoML Tables: the service that automatically builds and deploys a machine learning model
The first step is to upload the CSV file into a Cloud Storage bucket so it can be used in the pipeline. Next, you'll want to create an instance of Cloud Data Fusion. Follow the first two steps in the documentation to enable the API and create an instance.
In BigQuery, you'll need to create a table within a new or existing dataset. There’s no need to create a schema; we'll do that automatically in our data pipeline. Let's get started with the pipeline.

Creating the data pipeline

Cloud Data Fusion enables you to build a scalable data integration pipeline for batch or real-time scenarios. You can design the pipeline with UI components that represent standard data sources and transformations. The pipeline is then executed as MapReduce, Spark, or Spark Streaming programs on a Dataproc cluster.
Our pipeline will consist of three steps:
  • Retrieving the CSV file from Cloud Storage
  • Transforming the data into a format that is suitable for machine learning
  • Storing the processed data in a BigQuery table
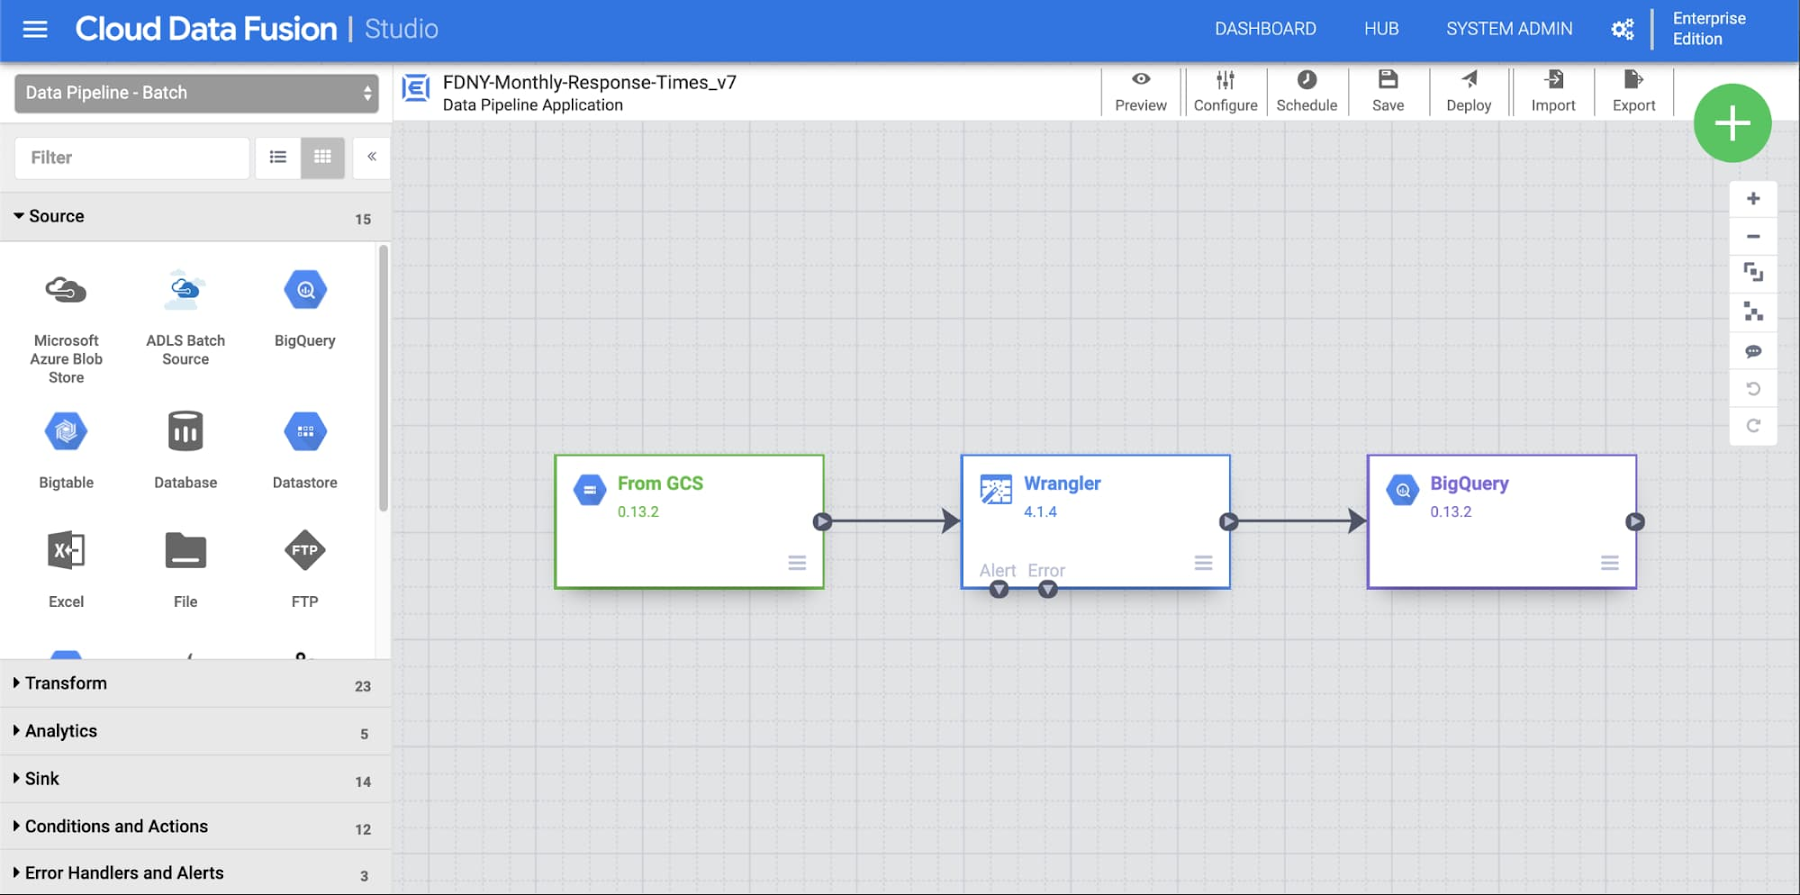
To get started, click on the Studio view to create a new pipeline. We’ll walk through each step of the pipeline illustrated here.


2.jpg

You can drag and drop each node, or plugin, to the canvas and connect them. Let's start with the input node. From the list of Source plugins, add a new GCS plugin to the canvas, then update its properties. Feel free to use your own label and reference name, and make sure that the path matches the location of your CSV file:

  • Label: From GCS
  • Reference Name: GCS1
  • Path: gs://<YOUR_BUCKET>/FDNY_Monthly_Response_Times.csv

Transforming the data

Next, we'll transform the data using the Wrangler plugin—a powerful component that contains a suite of parsing, transformation, and mapping utilities to perform common tasks with data. 
From the list of Transform plugins, add a Wrangler plugin and connect its input to the output of "From GCS." You can use whatever label you'd like, such as "FDNY Response Time Wrangler."
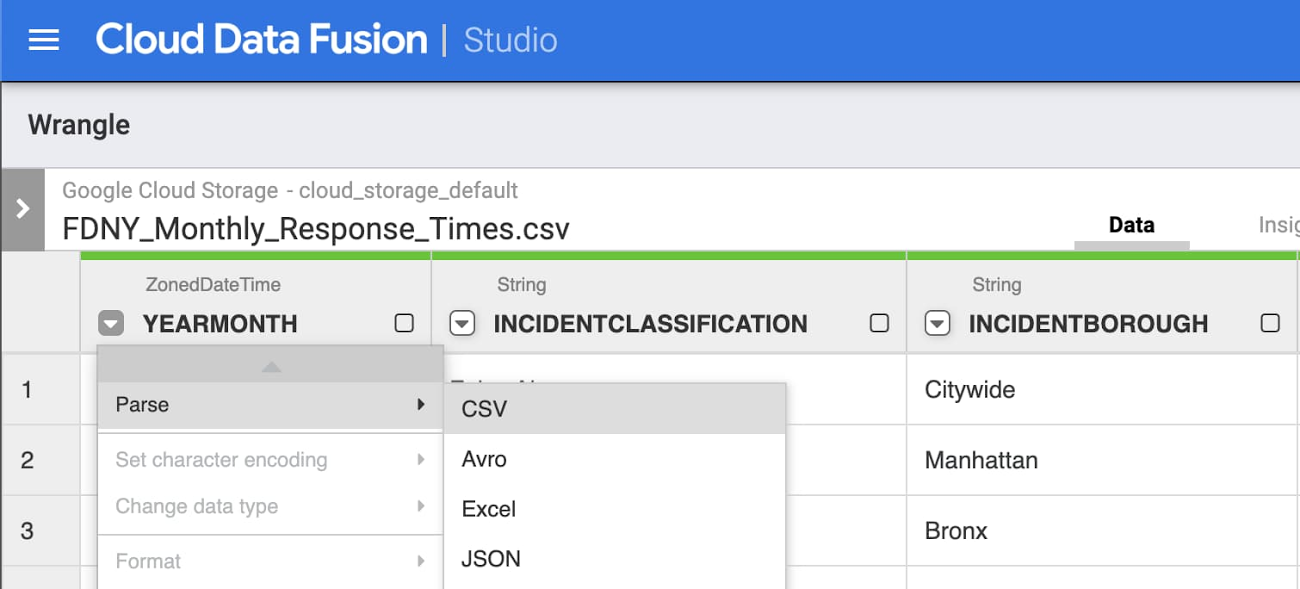
Click Wrangle and navigate to the CSV in the storage bucket. Then click the arrow next to body and select Parse -> CSV, with these options set:
  • Separate by comma
  • Check the box "Set first row as header"


3.jpg

Following a similar process as you did in the parse step, follow these additional steps to complete the transformations:

  • Parse YEARMONTH as a Simple date
    • Use custom format: yyyy/MM
  • Filter out All Incidents under INCIDENTCLASSIFICATION
    • Filter -> Remove Rows - > Value is "All Fire/Emergency Incidents"
  • Filter out Citywide under INCIDENTBOROUGH
    • Filter -> Remove Rows -> Value is "Citywide"
  • Delete columns body and INCIDENTCOUNT
    • We don't know the number of incidents prior to the month beginning
  • Remove the colon from AVERAGERESPONSETIME by:
    • Find and replace ":" with "" (no quotes)
  • Convert AVERAGERESPONSETIME to seconds with:
    • Custom transform: (AVERAGERESPONSETIME / 100) * 60 + (AVERAGERESPONSETIME % 100)

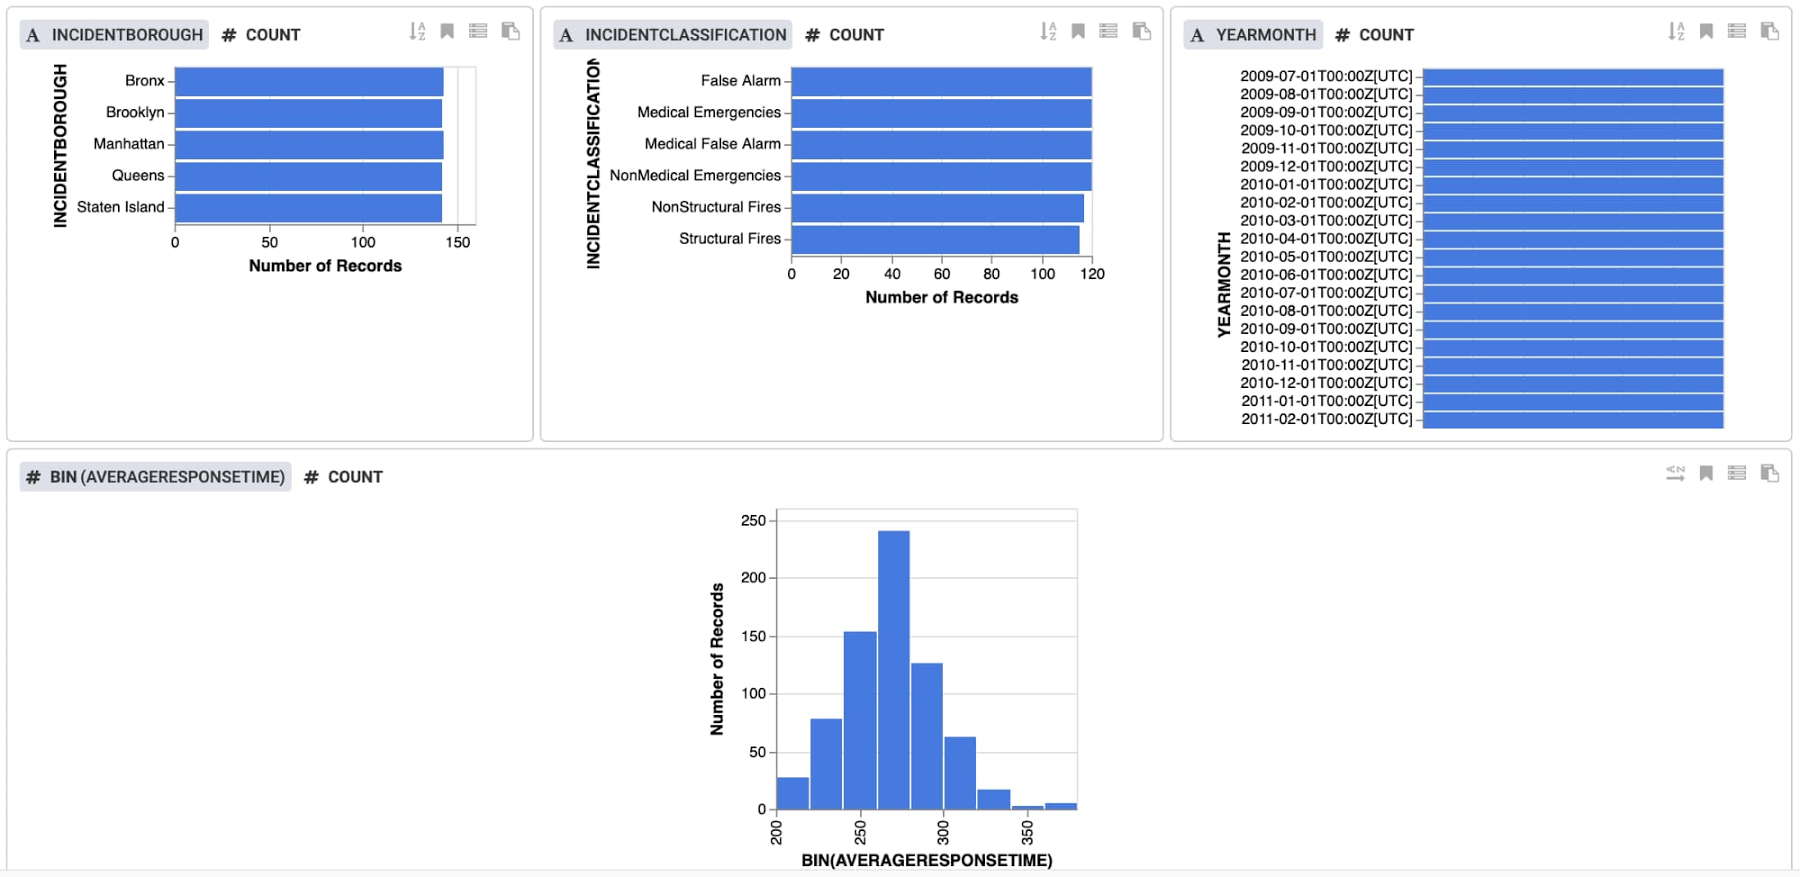
Click Insights near the top to review the data in more detail. Views are provided for each column, and you can also create custom views. The data indicates that there is a good balance of values for each feature, and we see a normal distribution of response times, centered around 270 seconds.


4.jpg

Click to Apply the transformations, and then click to Validate the plugin. You should see "No Errors" shown.

Storing the data in BigQuery

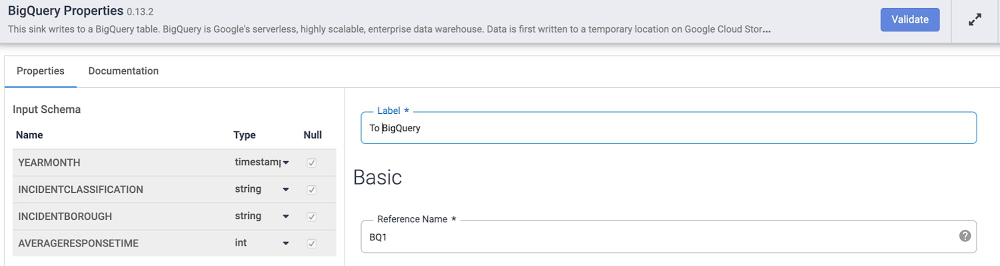
The final step of the pipeline will be to write each record into the BigQuery table. We'll set the Update Table Schema option in the BigQuery plugin, so that each data field name and type will be automatically populated in BigQuery.
From the link of Sink plugins, add BigQuery to the canvas. Then, click Properties to set the fields as follows:

  • Label: To BigQuery
  • Reference Name: BQ1
  • Dataset: <YOUR_DATASET>
  • Table: <YOUR_NAME>
  • Update Table Schema: True

Click Validate to ensure that your plugin is configured correctly.


5.jpg

Deploying and running the pipeline

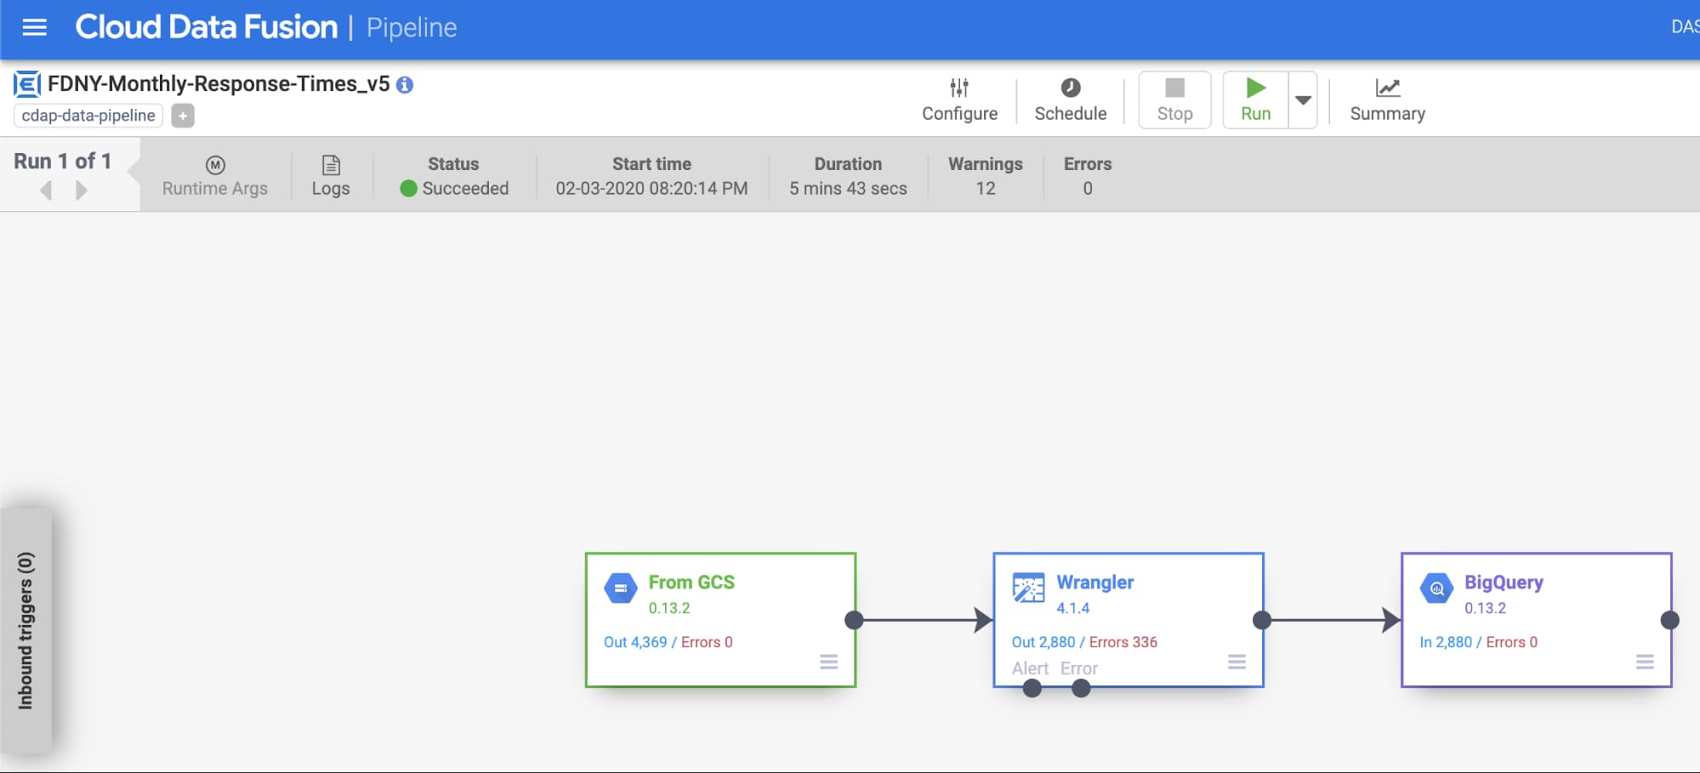
With our data transformed and in BigQuery, we're ready to deploy the pipeline. In the top menu bar, name the pipeline something like fdny_monthly_response_time and save it. Next, deploy the pipeline, which will take about a minute. Finally, you're ready to run the pipeline. This step will take several minutes to provision a Dataproc cluster and run.
By default, Cloud Data Fusion will create an ephemeral cluster to execute the pipeline, and will delete the cluster when finished. You can also choose to run the pipeline on an existing cluster. As the job proceeds, you can see information such as the status, duration, and errors.


6.jpg

Review the transformed data in BigQuery

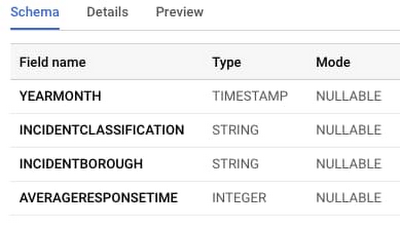
While you could skip ahead to directly import your model in AutoML Tables, it never hurts to review the output of the transformation. Access the BigQuery console and navigate to the table you've created. Click Schema to see what was created for you by the pipeline:


7.jpg

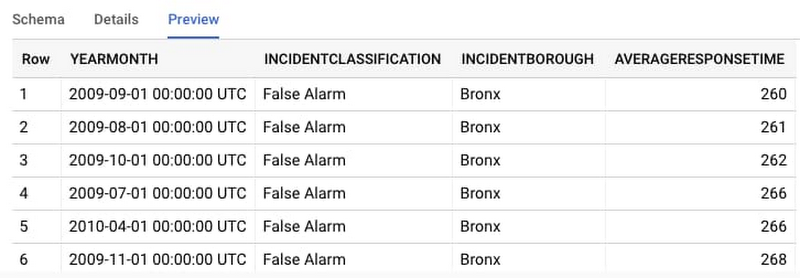
Then, click Preview to see some example rows from the dataset:


8.jpg

Build a model with AutoML Tables

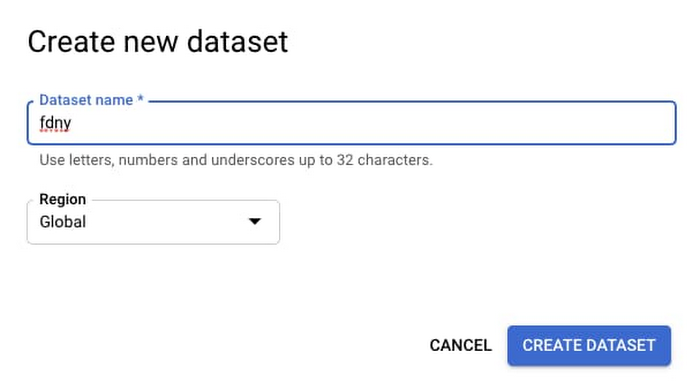
The data looks good, so now it's time to create a model! Access AutoML Tables and start by creating a new dataset.


9.jpg

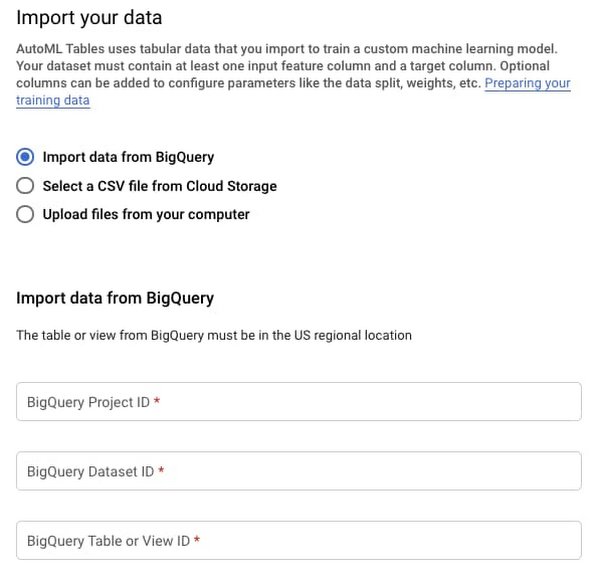
From there, you will need to import the data into your model. It's straightforward to directly import data from BigQuery: Simply provide the Project ID, Dataset ID, and Table Name, and then import the data.


10.jpg

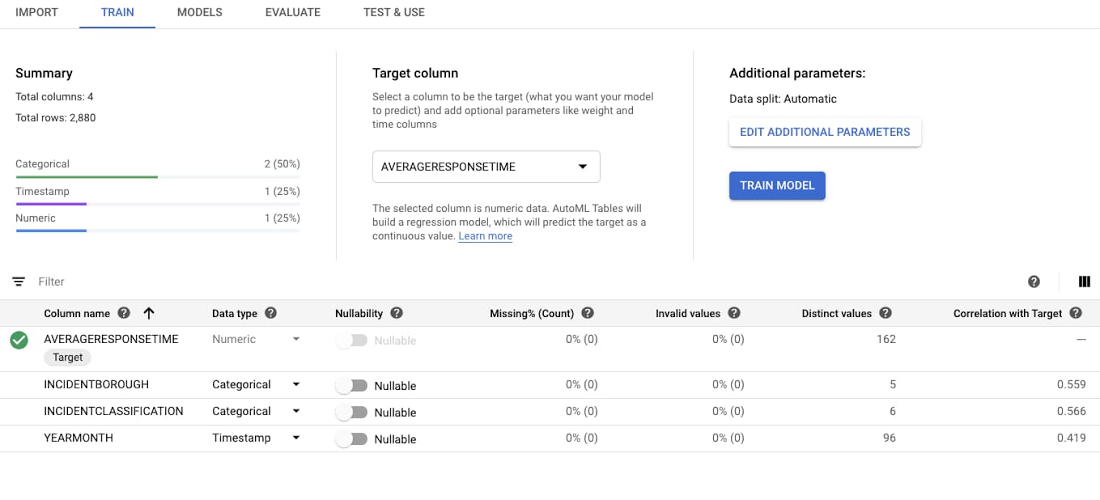
After you’ve imported the data, you can begin training. There's only one option you have to set, which is your Target column, or the variable you're aiming to predict. You will be predicting a numeric value, so you’ll be creating a regression model. AutoML also supports classification models, which are used to predict which category the input belongs to. AutoML Tables should infer the data types and the standard settings, such as an 80/10/10 Train/Test/Validate split, are fine as-is. Select AVERAGERESPONSETIME or the target column.
After selecting the target column, AutoML Tables will recompute statistics about each model feature. You can then select Train Model.


11.jpg

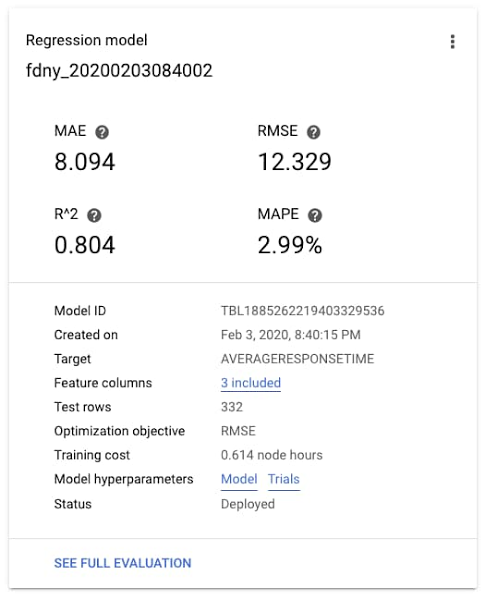
After some time, training will complete and you can review the accuracy statistics for your model. In this case, the MAE (Mean Absolute Error) is about 8 days, and the R2, or the variance explained by the model—which ranges from 0-1—is about 0.8. Not bad!


12.jpg

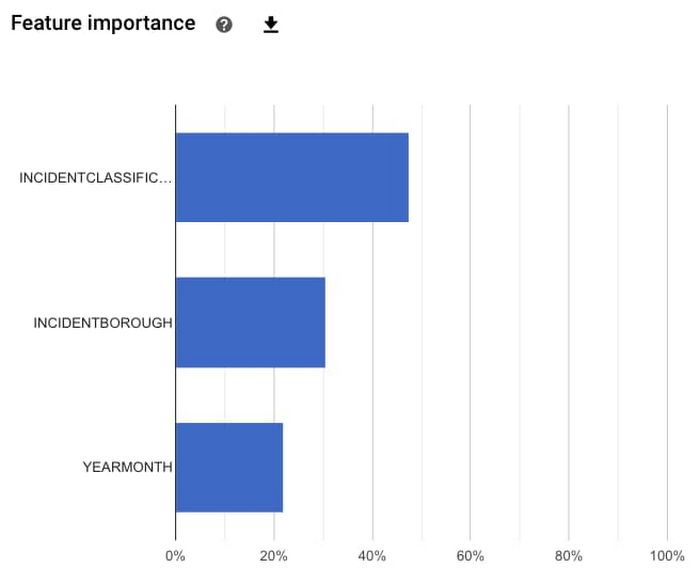
You can also see which features had the most predictive power in the model. In this case, it looks like the most important feature was the type of incident, then the borough in which the incident occurred, and finally the time of the year. The feature importances provided here are calculated across the entire test dataset, to understand the general magnitude of impact. We'll see later that you can find out feature importances for a specific prediction.


13.jpg

Finally, you can try predicting with your model. There are a few options available: batch prediction, online prediction, and model export as a Docker container. 
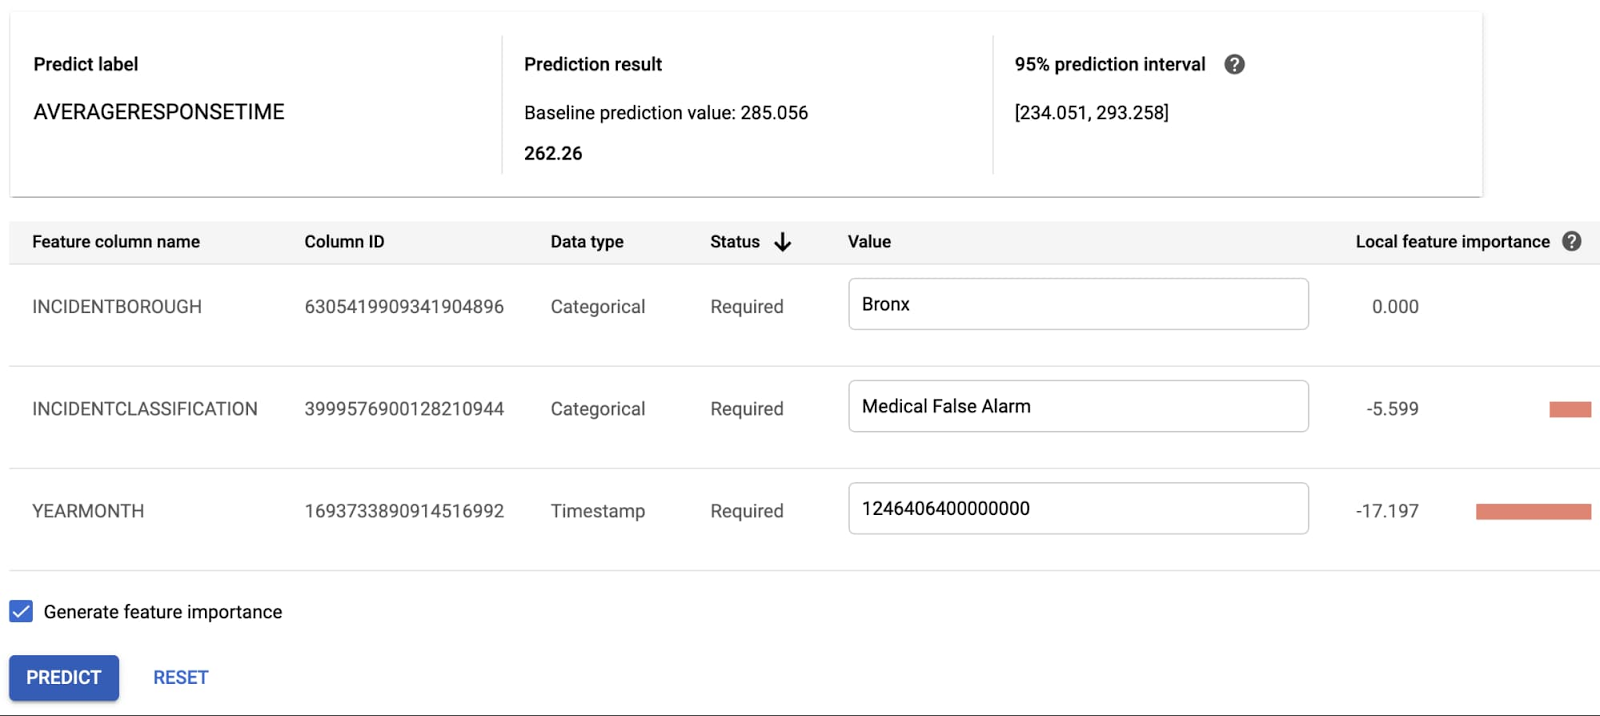
Let's try an online prediction. After deploying your model, you can access it as a REST API. The AutoML Tables user interface provides a handy way to test this API. Let's enter some test values. (Note the YEARMONTH field is a Unix timestamp in microseconds. For example, 1246406400000000 in the table below is midnight on July 1, 2009.) You can see a prediction result of 262.26 seconds! You also see that YEARMONTH had the largest impact on this particular prediction.


14.jpg

Wrapping it up

In this post, you've seen that it’s possible to build a robust pipeline and ML model without coding. Under the hood, each step of the process is realized by scalable infrastructure. The pipeline runs on a cloud native Dataproc cluster and inserts records into a scalable BigQuery data warehouse. We then run a neural architecture search in AutoML Tables to build a model.
And, remember, we didn’t start with a squeaky clean dataset, either. Being able to transform less-than-perfect data to something your model can use opens up machine learning to even more use cases. So, whatever your use case is, enjoy your next experience working with these powerful tools.